The overall and stage results charts are part of the PRO features of the PractiScore Competitor app.
These charts are designed to assess competitor performance relative to other competitors in the match. The following charts are supported:
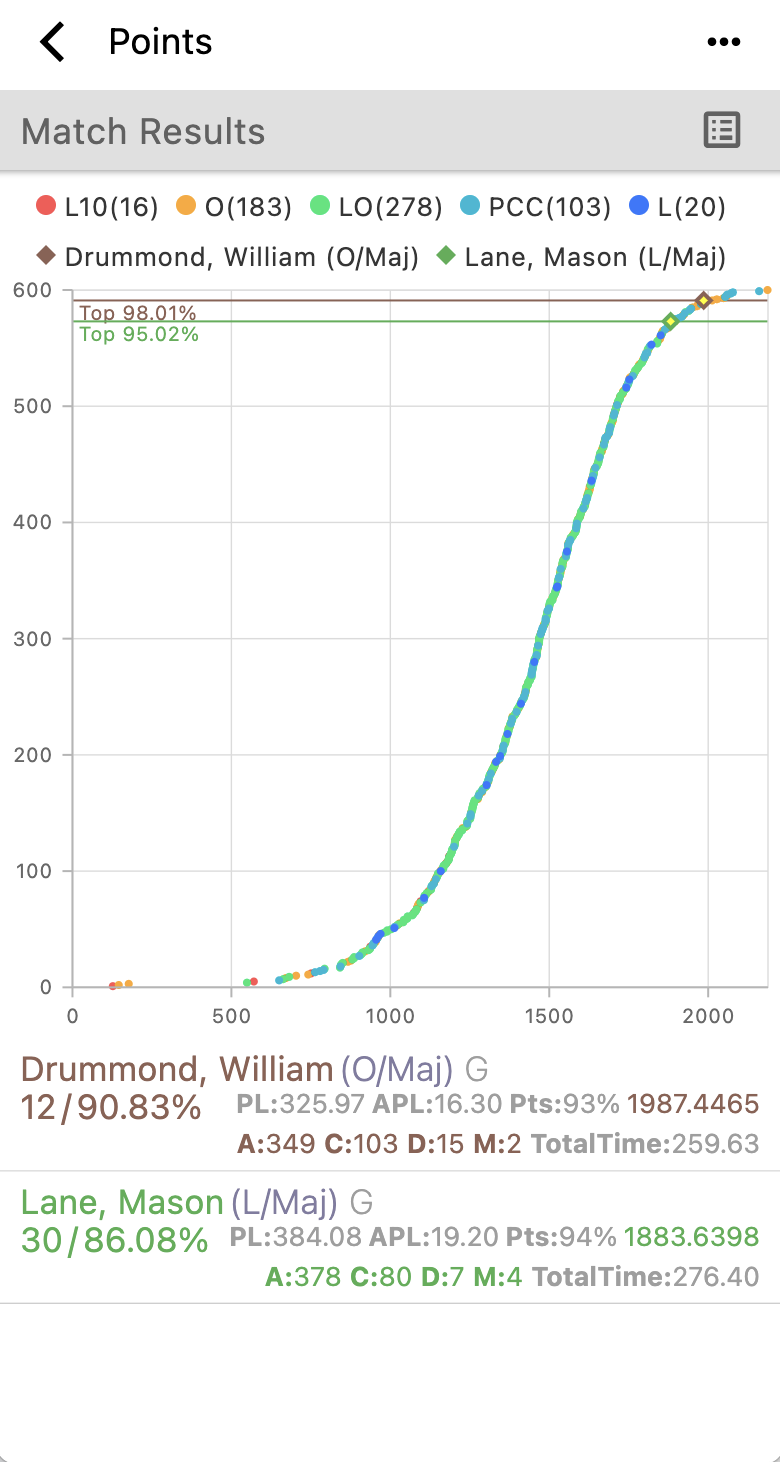
- Match or stage points (HF, TimePlus points scoring)
Competitor’s points is plotted on the X axis and chart shows the percentile of selected competitor’s points - Match or stage final time *(IDPA and TimePlus scoring)
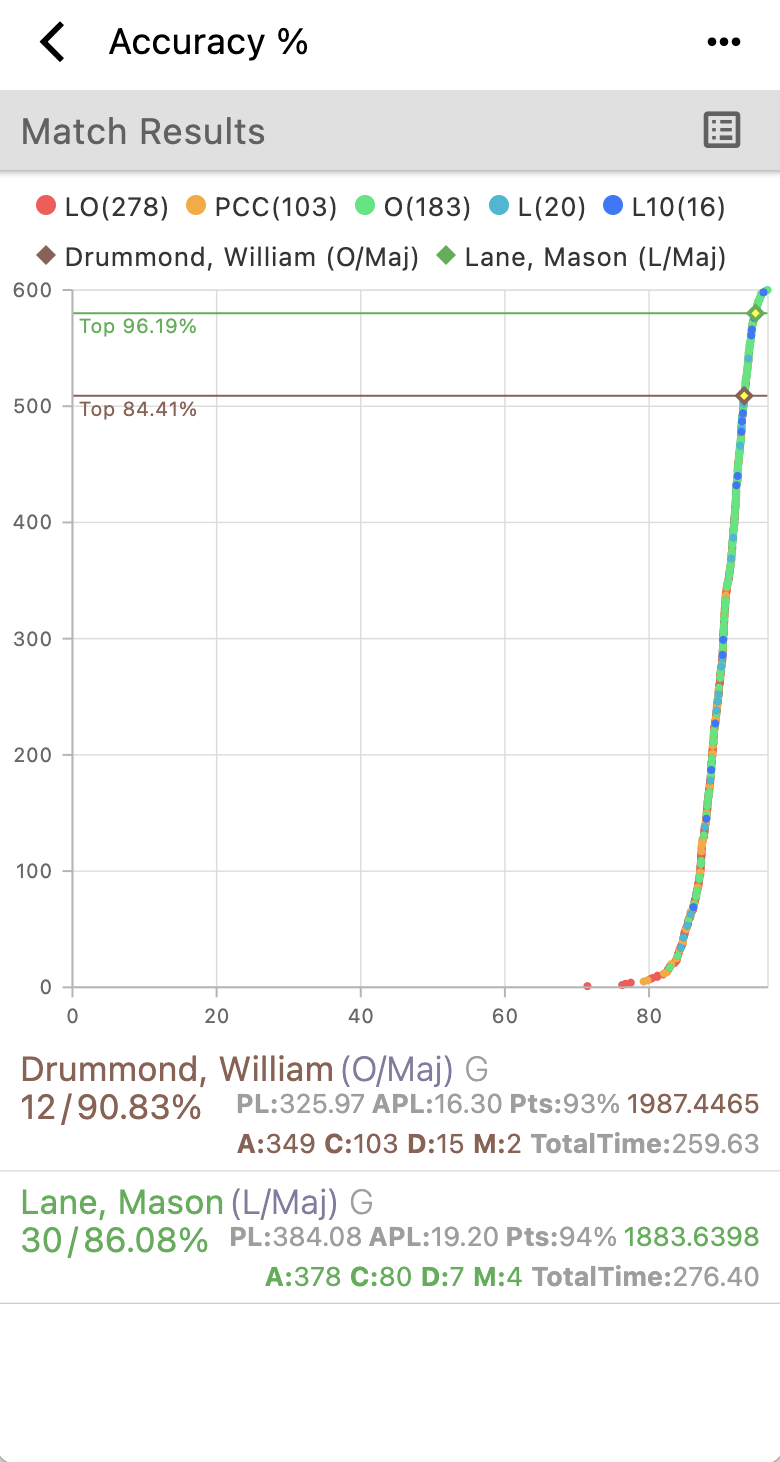
Competitor’s final time is plotted on the X axis and chart shows the percentile of selected competitor’s points - Match or stage accuracy % (HF, ICORE scoring)
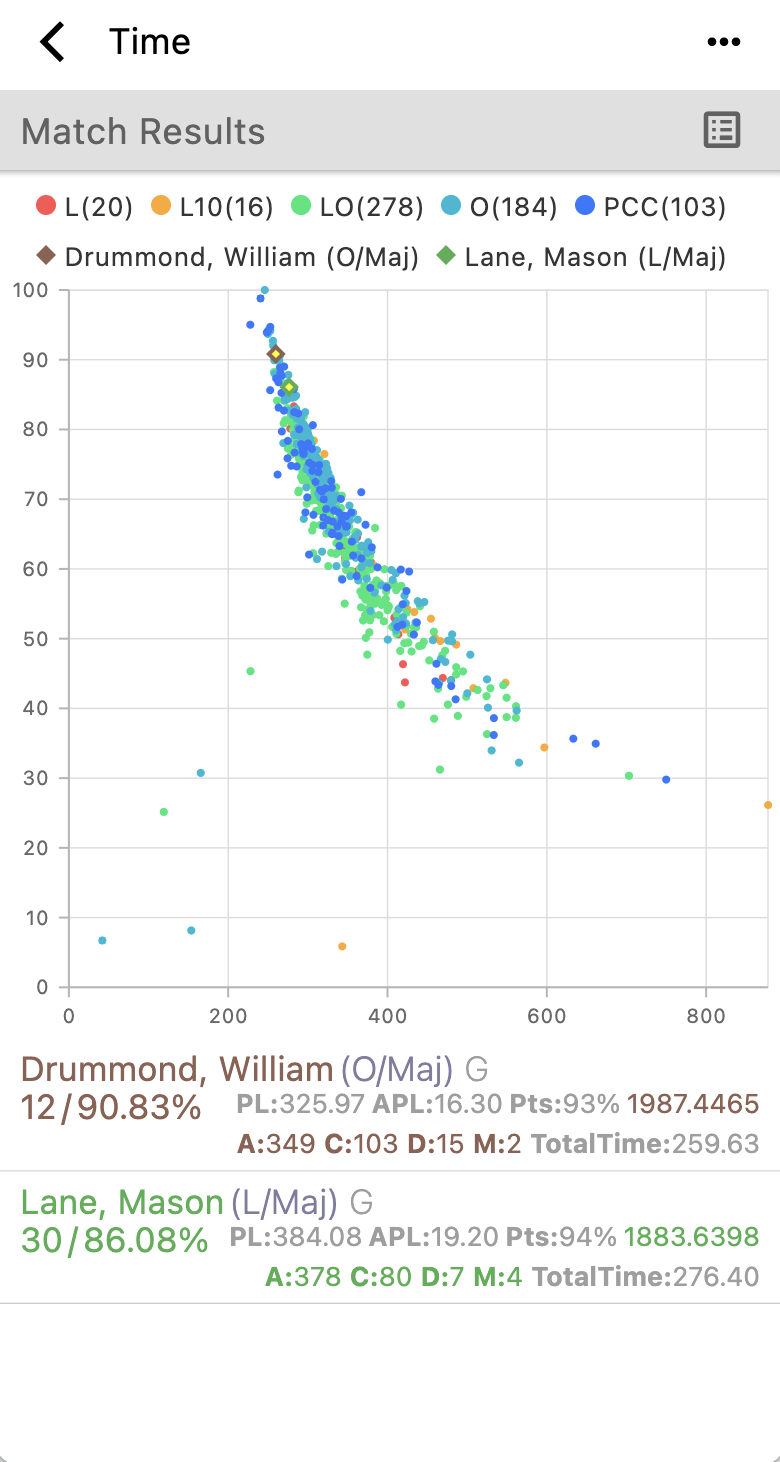
Competitor’s accuracy % is plotted on the X axis and chart shows the percentile of selected competitor’s accuracy %. - Time (HF, IDPA, ICORE, Steel Challenge, TimePlus, TimePlus points scoring)
Competitor’s raw time is plotted on the X axis and Y axis shows their match or stage standing %